Education is a dynamic process. It is always changing. Technologies change. Curriculums change. Facilities change. But perhaps the one element that changes the most is the students. Do you agree?
SmarterServices recently published the National Readiness Report which provides quantitative, nationwide insight into trends in student learner readiness. Recently, we presented a webinar on the findings.
Watch this on-demand webinar below to hear Dr. Mac Adkins, Chief Academic Officer for SmarterServices, present the research findings. He will also share information on the degree to which the COVID-19 pandemic impacted learner readiness, and statistically significant findings of differences in learner readiness across age groups, gender, ethnicity, online learning experience, school choice, and first-generation status. Check it out!
Click here to download the National Readiness Report.

Don’t want to watch the webinar video? No problem. Keep scrolling to read the webinar recap below for more information.
Webinar Recap
What is the National Readiness Report?
The National Readiness Report is a report that SmarterServices produces yearly which provides data from all of the students in that prior year who took the SmarterMeasure Learning Readiness Indicator. It provides demographic distributions, scale and sub-scale means, and a comparison of means between demographic groups.
SmarterMeasure is an assessment that quantifies a learner's level of readiness for learning in a collegiate environment based primarily on non-cognitive indicators of success. It has been around since 2002. From 2002 until today, it's been taken by over 6 million students from over 1,000 institutions — averaging about 100 assessments being taken per day.
Because we have been compiling these reports since 2008, they provide a unique longitudinal view into trends among students related to their levels of readiness for learning.
What Factors are Measured by SmarterMeasure?
 In case you are new to this topic, let’s review what the SmarterMeasure Learning Readiness Indicator measures.
We start by analyzing the students internally. This scale is called “Individual Attributes.” It measures factors such as motivation, control over procrastination, willingness to ask for help, and locus of control.
While we are looking at the learner internally, we also measure their preferred “Learning Style.” This is based on the multiple intelligences model, so it measures the degree to which they are a social, solitary, visual, or verbal learner.
After we have looked at the student internally, then we examine them externally in a scale called “Life Factors.” It measures variables such as availability of time, support from family and employers, having an appropriate place to study, general health, and finances.
In addition to measuring these traits and attributes, we also measure several skills that the learner possesses. These skills include on-screen reading rate and recall, technical competency, LMS competency, technical knowledge, and keyboarding rate and accuracy. The learners’ level of readiness for college-level math and writing is also measured on the assessment.
An Analysis of Demographic Factors
During the academic year of 2021, we had almost a half-million students take the SmarterMeasure assessment. The data analyzed for this report looked at the data during a calendar year. The data below is collected from 2021.
A few things to keep in mind about this data:
- The data is from all institutions in our database.
- The unique dimensions of your students may differ from those in the national data set.
- Schools can opt to remove add, edit, or replace the demographic questions.
- Students may opt-out of answering demographic questions.
Here’s a breakdown of the data from the report:
- Almost half of the students (48%) were traditional-aged college students.
- The majority (84%) were female.
- The most frequently reported ethnicity was Caucasian.
- Half of the students had not taken any prior online courses.
- Solitary was the most frequently reported learning style.
- Almost half of the students (48%) were very confident in their school choice.
- 11% of the students were not sure of their confidence in their school choice.
- About one in three (34%) were first-generation college students.
Knowing this data enables institutions to identify students that may need to be given more support and who may need to be reached out to in order to help maintain/increase student retention.
Demographic Factors and Learner Readiness
In addition to computing and presenting the distribution of the demographic factors, we also perform a statistical analysis to determin
e if the differences in levels of readiness between demographic groups are statistically significant. Here are those findings.
- Age impacts readiness.
- Statistically significant differences in means were found with those who were not traditional-aged college students having significantly higher means for Individual attributes, life factors, reading, technical knowledge, and technical competency.
- No significant differences in means were found between age groupings for keyboarding, math readiness, writing readiness, and LMS competency.
- Gender does not as strongly impact readiness.
- Females were found to have statistically significant higher means on the scales of individual attributes and math readiness while males showed significantly higher means on technical knowledge. The differences in means were not significantly different between genders on all other scales.
- No one ethnicity is dominant related to learner readiness.
- African Americans had the highest means for life factors. Caucasian students had the highest means for reading, keyboarding, and technical competency. Asian or Pacific Islanders had the highest mean for technical knowledge.
- Prior online learning experience is the strongest correlate of readiness.
- For all seven scales for which a significant difference in means was found, persons reporting having taken five or more prior online courses reported the highest means. Statistically significant differences in means were found for all scales except math readiness and writing readiness.
- Students who are confident in their school choice are also typically the most prepared.
- Statistically significant differences in means were found on the scales of individual attributes, life factors, and technical knowledge. This was the highest mean on all three scales being reported by those who were "very confident" that they had enrolled in the right school for them.
- Being a first-generation college student continues to be a challenge.
- Students who were not first-generation college students had statistically significantly higher means on life factors, reading, keyboarding, and technical competency.
The Impact of the COVID-19 Pandemic on Learner Readiness
One of the most impactful events of the past decade was the quarantine period of the pandemic (AY 19/20). This momentous shift in the way that education was delivered is sure to have had an impact on learner readiness. As we begin to emerge from the pandemic, we can begin to look at changes in trends before, during, and after the quarantine period.
To determine the impact of the COVID-19 pandemic on the construct of learner readiness, the following analysis of trends regarding the mean scale scores was computed. This table displays the mean scores by academic year for the scales measured by SmarterMeasure. The lowest means are displayed in red.
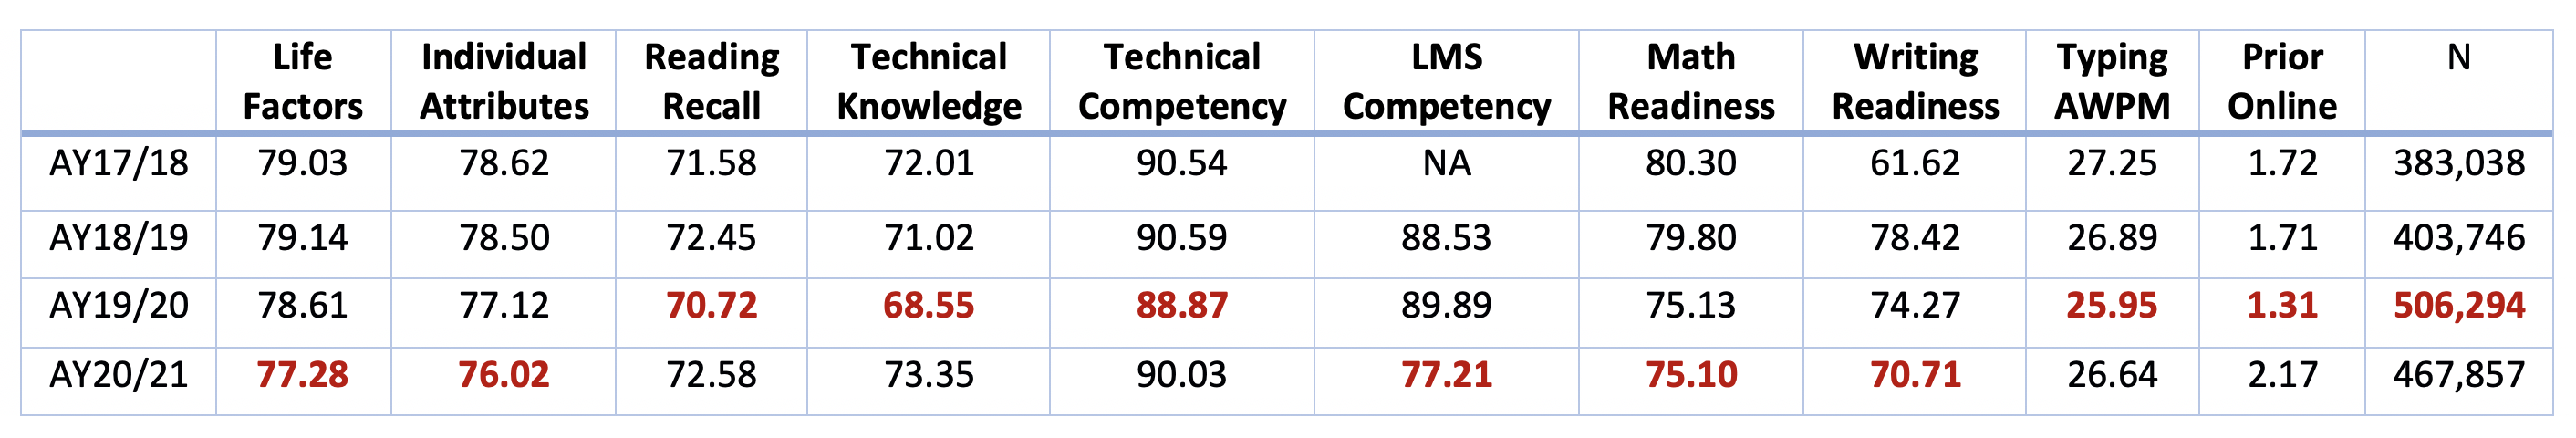
Impact of the Pandemic on Student Skills: During the COVID-19 pandemic, many institutions closed their doors and moved much instruction online. This prompted many students for whom online learning was not their first choice to be constrained to learn by an online learning modality. This reduction in levels of learner readiness is demonstrated by the lowest mean on half of the scales we measure being experienced during the quarantine year of AY 19/20. The following scales revealed the lowest means during that year: Reading recall, technical knowledge, technical competency, and keyboarding.
Impact of the Pandemic on Experience: It is also telling to note that during the quarantine year, more students with no prior online learning experience studied online than ever before. One positive note is that after the quarantine year there are now a higher number of students who have experienced learning online.

Impact of the Pandemic on Assessment Volume: During the quarantine year of the pandemic, more persons took the SmarterMeasure Learning Readiness Indicator than ever before. The diminished level of learner readiness reported by the assessment coupled with the inferior quality of emergency remote instruction when compared to traditional online learning is what prompted concern among many about the efficacy of academic continuity efforts during the pandemic.
Declining Non-Cognitive Attributes: Mean scores on the life factors and individual attributes scales have consistently declined over the past four years by about two percentage points. This is a substantial observation since these scales measure learner attributes, not skills. As such, these measurements are not delivery system dependent, meaning that they are equally important for students studying online, hybrid, or face-to-face. It is paramount that institutions measure this data for all students and provide appropriate strategies for intervention and support since students are struggling more in these areas than in the past.
Declining Cognitive Readiness: Generally speaking, mean scores for the math readiness and writing readiness scales have consistently declined over the past four years by 5 to 8 percentage points.
Actions Your Institution Can Take
So what are some actions that you can take at your institution as you reflect on this data?
- Continue to measure non-cognitive readiness. It matters more than ever — students are not as ready as they used to be.
- Compare levels of readiness across demographic factors to identify the populations most at-risk.
- Change any of the student support interactions that are not adequately addressing the at-risk populations such as inexperienced online learners.
- Communicate your workflow improvements internally and externally.
Continue Learning With Us
Want to keep learning? Check out the full webinar for more information about data from the National Readiness Report, plus some helpful audience questions that we cover.
Click here to download a free, full copy of the National Readiness Report for you and your institution to review.

.jpg)