Student support is certainly not one size fits all. What truly helps one student many not be beneficial for another. Strategies that one school uses may not be a good match for the culture at another institution.
At SmarterServices we get it. That is why we have a dedicated Customer Services Manager for each client to walk alongside them and suggest good practices that fit the unique dimensions of their students. One of the tools that we equip our Customer Success Managers with is data about successful approaches being used at various schools.
Sometimes this data is shared in the form of a qualitative case study that takes an in-depth look at a challenge faced by one school and an intervention that worked for them. You can review several of these case studies here.
Periodically, we also ask our clients about patterns and good practices in the way they utilize the SmarterMeasure Learning Readiness Indicator via a survey. You can click the image to the right for a free download of the data, watch the video below, or continue reading to see the results of our SmarterMeasure Usage survey.
When Do Students Access SmarterMeasure?
One of the most common questions that schools who are new to the assessment ask is where and when to position the assessment. We reply that there is no right or wrong point in the student experience to position it.
This survey revealed that the most common place is in an orientation course. This is a good thing, helping students understand that an orientation course is an effort of the school to help them succeed. When they take SmarterMeasure as an activity in the orientation course they are likely to perceive it as a beneficial experience. Also, many schools provide a discussion board (online course) or focus group (local course) that allows students to reflect within the community of the course about their level of readiness.
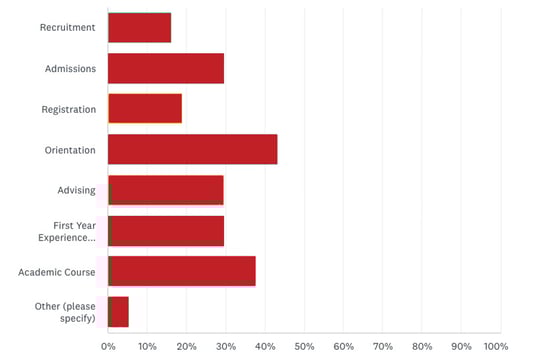 The second most common position is in an academic course. For example, students have placed it as the first assignment in an English 101 course. After completing the assessment students are tasked to write a one-page pager about their own level of readiness. This prompts the students to reflect on their course and also provides an early writing sample of the student's composition skills.
There was a three-way tie for third place with admissions, advising, and first-year experience courses being equally utilized. Other places included during the recruitment process and at the time of registration.
What Groups Take SmarterMeasure?
Related to the question of the timing of the assessment, was one about which specific populations of students are prompted to take it. Over half (54%) of schools responded that all populations of students are prompted to take it. The second most common group was persons who are new to online learning. These two were followed by several other student populations including TRIO, Upward Bound, provisional academic status, transfer students, and graduate students.
Which Scales are Offered?
Not only are schools able to choose who they offer the assessment to and when, but they are also able to select the scales that are most relevant for their students. The four scales that almost all schools are offering are Life Factors, Technical Competency, Learning Styles, and Individual Attributes. After that some schools opt-out of some scales based on the needs of their students.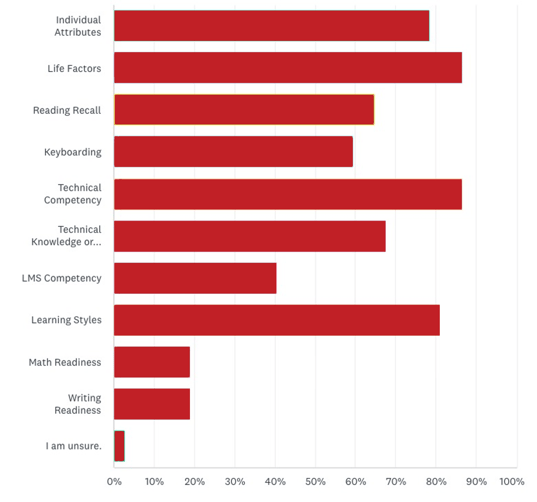 It was encouraging to see that adoption levels of our three newest scales is growing rapidly. 40% of schools are now using the LMS Competency scale and about one in five schools are using the math and/or writing readiness scales.
Is it Required?
Another question was whether schools require students to take the assessment or if they make it optional. The majority (64%) of schools do make the assessment required.
While the choice is certainly up to the school, schools are encouraged to position it as a requirement because if it is not, then the results are open to self-reflection bias. When students have a choice about whether to take the assessment, it is often the case that students who could benefit from it the most, are the ones who opt-out of taking it. Some of the elements that challenge a student in their collegiate study (time management, control over procrastination, etc.) also impact their choice of whether to invest the time to complete the assessment.
Conversely, there are some clients who do not require the assessment and then use the behavioral data of the students who did not take it as a flag of a student who may need immediate support or encouragement.
How do Schools Respond?

Equally important as where the assessment is positioned is how schools respond to the assessment results. Most schools (60%) do what we strongly encourage and that is for someone at the institution to go over the scores one-on-one with the student. Typically, this is done by an admissions counselor, academic advisor, success coach, or faculty member. Not only does this process foster a meaningful conversation with the student, but it conveys that the school is interested in the student's success, and it introduces them to someone at the school who will be there for them as needed.
40% of schools look at the data in aggregate to determining gaps in student support services. If your school is already using SmarterMeasure and you are not sure how to run the reports that show all of the measures of central tendency across all scales and sub-scales, let your Customer Success Manager know, and will be glad to show you how this is easily done.
All learning, even online learning, happens in community. For this reason, it was encouraging to see that about 20% of schools discuss the results as a group in the class. This is beneficial because it often helps a student to recognize that they may not be the only person who struggles in certain areas.
Do You Export the Data?
Because schools frequently analyze the data in aggregate, we also asked if someone at the institution was regularly exporting the data. Over half (51%) of schools reported that they were exporting the data from the admin panel to use in further analysis. If you are not familiar with how to export the data, please reach out to your Customer Success Manager.
How do You Configure SmarterMeasure?
SmarterMeasure is now in its twentieth year of usage. Across that time over six million students from over a thousand institutions have benefitted from it. Also, over that time the assessment engine that it is provided in has evolved. Unlike some other services, SmarterMeasure never charges for the ability to configure and customize the assessment.
We asked schools about which configuration features they used the most. Over half (54%) integrate the assessment into their LMS. This provides the assessment in a branded, intuitive interface and also achieves single sign-on and grade book integration. Many institutions (34%) reported that they customize the text on the student login page as well as the support links on the student report.
About one in three schools added their own custom questions. While we strive to keep the assessment itself standardized to enable peer institution comparisons, we do encourage schools to add additional questions about factors that are relevant to them.
Can Others Contact You?
We love our clients. We love working with them and we love the collaborative culture between our clients. On the survey, we asked if they would be open to having other clients and/or prospective schools reach out to them for a conversation about the assessment and how it benefits their students. About half of them were willing to take that call.
If you would like to speak with some of our partner institutions about fostering learner readiness and boosting retention through the use of the SmarterMeasure Learning Readiness Indicator, let us know and we will pair you with a similar institution for a conversation.
.jpg)